
Data and Education?
A quick survey of the Web turns up many helpful pages on data analytics. But because data is the currency of our now digital economy, the articles typically focus on the business world. Any mentions of data in terms of education usually surface one of three understandable perspectives: protecting student privacy, boosting engagement (i.e., $) and the mostly misguided use of high-stakes, though meagre, metrics to represent human learning.
Furthermore, some educators can be hesitant about “data.” Maybe data seems like numbers and graphs while our role is to nurture growth in human beings? But the right data is an asset in our very human task as it can provide some evidence about how things are going. Quality data, easily accessible and effectively visualised is one way to gain insights on such questions as:
- Are students learning?
- What are they learning?
- What aren’t they learning that could help them grow?
- What pedagogical approaches are the most effective for which students?
- How can our school and system use these insights to keep getting better?
This post will provide background on the four types of data analytics and offer four tips for educators. Let’s start with a graphic that we can unpack:
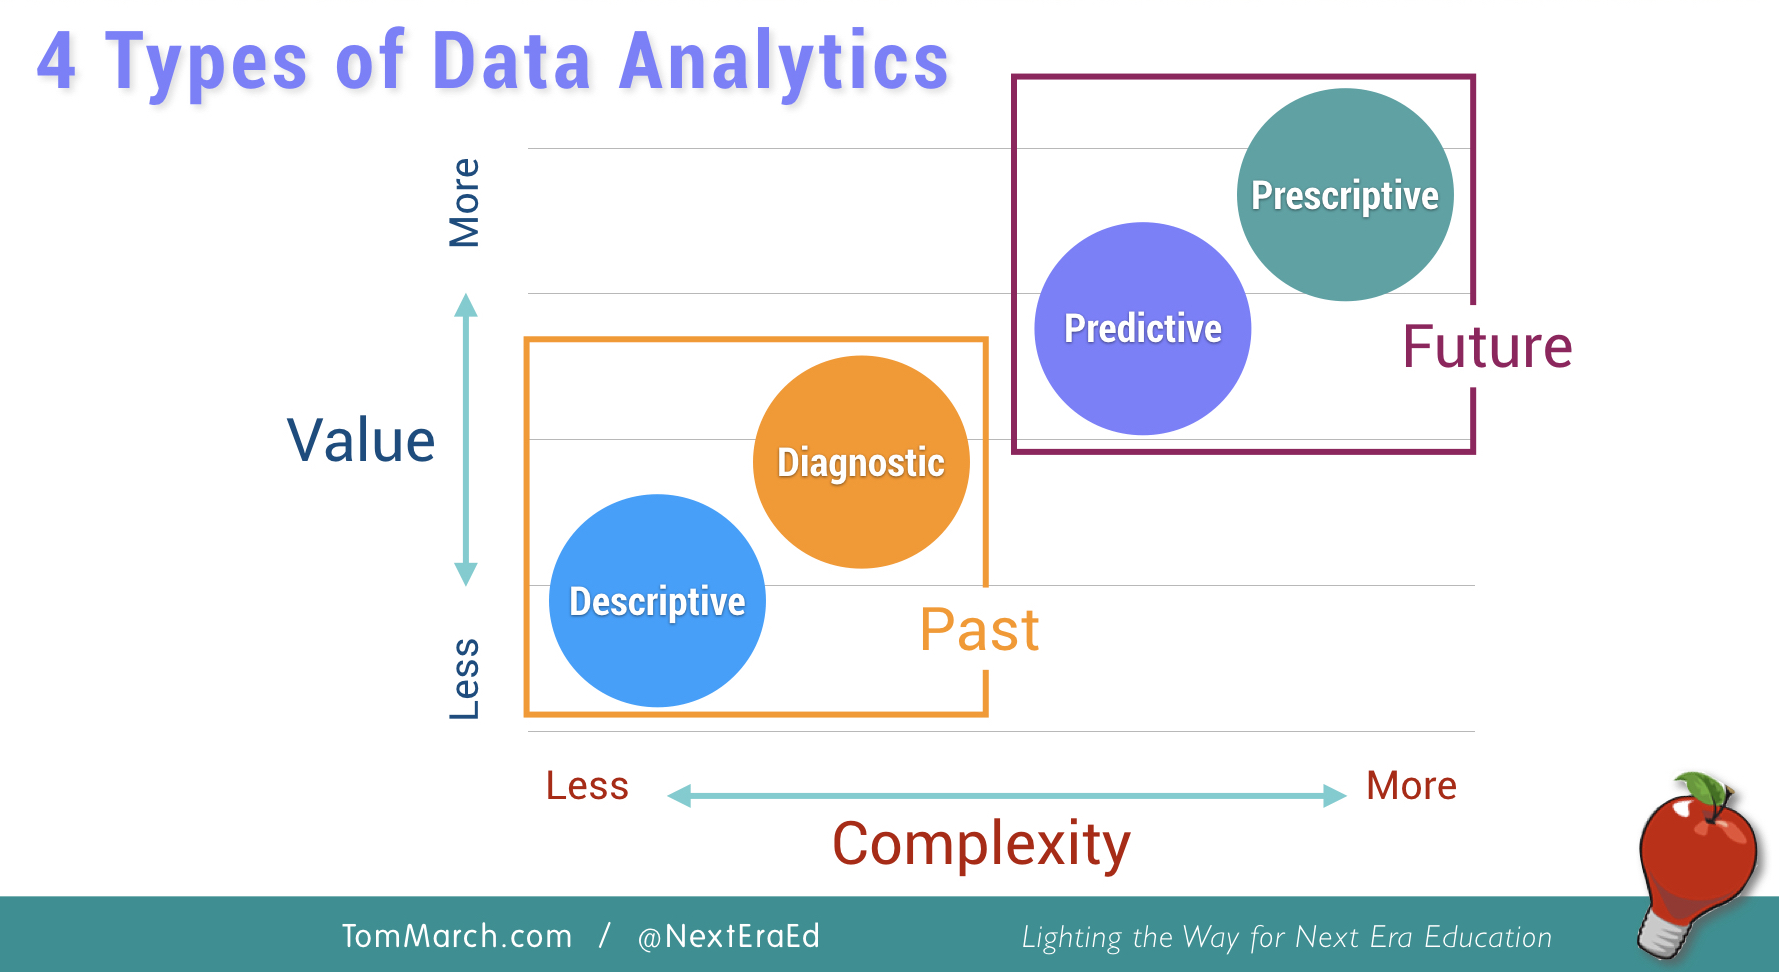
What are the Four Types of Data Analytics?
A handy way to understand data analytics is to view it in terms of what it can do for us:
- Describe – what’s already happened
- Diagnose – why did it happen
- Predict – forecasts what might happen in the future
- Prescribe – recommends what to do
The first handy thing to notice is that the “D”s are about the past and the “P”s are in the future. The other useful dimension is the common sense relationship between value and complexity: the simplest data is also the least useful, whereas the most complex has the potential to add the most value.
Now let’s see how the the four types of analytics align with data sources schools already know. I’ll also highlight how complexity and value factor in.
Descriptive Analytics
Descriptive analytics can tell us “what happened.” This is by far the most common type of data used in schools. When teachers give tests at the end of a unit and assign a mark or compile semester reports, they are generating descriptive data. Other kinds of descriptive data schools might collect are attendance records, participation in co-curricular activities, literacy progressions, feedback surveys, etc.
Value and Complexity
Teachers and schools invest extraordinary resources collecting such information, so it’s unfortunate that these only provide a simple “backward glance”. As much detail as a teacher might consider before assigning a result, in the end, it’s typically an A-E grade or 0-100 percentage.
Applying Analytics
Probably the main applications of these datasets are ranking students and potentially serving as extrinsic motivation. However, careful analysis of such descriptive data across a school can help identify variability (and success?) among teachers and faculties, identify patterns for specific student cohorts, and compare academic achievement in the context of things like school engagement and well-being.
Diagnostic Analytics
Diagnostic analytics offer more in-depth insights into student performance or ability. In Australia, when people think of diagnostic data in education, what comes to mind are standardised or “high stakes” tests such as the National Assessment Program – Literacy and Numeracy (NAPLAN) or ACER’s Progressive Achievement Tests (PAT). In the primary years, many schools use commercial benchmarking programs (such as PM, F & P and Probe). Some online programs / apps also provide diagnostic data. In the classroom, many teachers use formative assessments and rubrics to assess students’ skills. What these all have in common is that, just like a medical doctor reviewing blood tests or x-rays, diagnostic assessments provide greater detail about what’s going on.
Value and Complexity
This greater detail we can call “granularity”. So the real benefit of, say, a NAPLAN Reading assessment is not to find out what Band a student is in, but to gain insight into a student’s strengths and gaps in core skills related to the domain such as “connecting information,” “applying comprehension” or “inferencing.” With this greater degree of complexity, you can see how the value increases. Rather than try to help that student “read better,” we can target teaching to fill gaps and extend strengths.
Applying Analytics
Taking advantage of the diagnostic assessments used in a school is a challenge, mostly because the data is buried and not easily visualised. When teachers, faculties, grade-levels teams and leaders can quickly see such gaps and strengths across core skills at the student, class and cohort levels, each stakeholder is empowered to support targeted solutions.
Predictive Analytics
Predictive analytics can offer insights into “what is likely to happen.” It uses the results of descriptive and diagnostic analytics to predict future trends. As such, predictive analytics forecast likely outcomes to be pursued or avoided. Many schools employ data consultants to conduct statistical reviews of past performance in high-stakes measures, especially Year 12 results such as HSC, VCE and Advanced Placement tests.
Value and Complexity
Clearly, because solid predictive analytics is based on equally solid descriptive and diagnostic data, it is more complex to gather and analyse. The reason schools often outsource this analysis to data experts is because of the statistical analysis required and also the savvy to integrate appropriate data sets. Equally complex is the interpretation of the analysis so that patterns aren’t seen as causative when they might really only correlate (e.g., high participation in co-curricular activities may correlate with high achieving students, not cause the high achievement).
Applying Analytics
Besides employing data scientists, schools can begin use of predictive analytics by identifying what information they most value about students and their learning. This might require introducing new descriptive and diagnostic measures and then taking several years to grow these data sets.
Prescriptive Analytics
The fourth type of analytics results in actual prescriptions of “what action(s) to take” to solve a problem in the future or to take full advantage of promising trends seen in the predictive analysis. Many schools engage in pedagogical initiatives such as Reading Recovery, Maker Spaces, STEM, writing across the curriculum or wellbeing programs, but such decisions typically lack a robust foundation in hard data. It’s not that such initiatives are bad, but when they are begun without targeting an evidence-based issue with aligned pedagogical solutions, measuring success is ad hoc at best. One downside of such initiatives lacking credible success criteria is the drain on staff morale and change fatigue. We are all motivated when we perceive ourselves as being effective. Without measures, this is difficult.
Value and Complexity
Like predictive analytics, prescriptive is also based on data from each of the other types and thus requires both quality data and insights (see the next article on Tips for Educators). Obviously, the value-add of such predictive analytics is great, but the complexity needed to combine and model the data is comparably great.
Applying Analytics
Both the value and complexity of prescriptive analytics suggests not only the participation of experts, but also technology. In fact, this is where many tech companies get involved and apply Artificial Intelligence to the rapid modelling of data. “Big data” sets are needed for algorithms to apply both unstructured and structured analysis to tease out reliably demonstrated outcomes. A good example is the increasing sophistication and accuracy of tech giants like Google and Amazon to make suggestions based upon constructed profiles for each user. In this way AI can move beyond more simple “if/then” predictions to an assurance that specific actions will lead to the desired outcome. Extensive work is being done in this area at the university level.
Where to Next?
As you can see, most schools would collect, use and benefit from each of the four types of data analytics. Yet, it’s the rare school that has a mature approach to managing and employing the data circulating through its software, systems and folders. Now that you have more background on the types of data and analytics, please read the next article offering 4 Tips on Data Analytics for Educators.


 In my last post, I suggested that education would do well to mine the wealth of information that can be derived from digitally tracking student movements. A lot can be learned through amassed patterns of student use within software virtual environments and actual physical environs. Today Education Week reports about a