Good News! All the links on the Big Wide World WebQuest have been updated, so it’s ready for use. Right Now! What was particularly great about this updating is that the kinds of links students can use have gotten so much richer since the last refreshing. Site like the Stellarium and Climate Time Machine (as examples) really make this a hands-on and engaging experience for students (and rewarding for teachers and parents. Let me know what you think – always happy to tinker.
Introduction
Because people kept asking whether younger students could do WebQuests, I created The Big Wide World WebQuest as a way to immerse younger students in a teacher-facilitated exploration of the world. Inspired by a son’s school field trip into the local farms and paddocks, I used the WebQuest to engage them in some of the bigger picture aspects of our world (seasons, climate, biomes, animals, plants, culture, etc.).
After watching the video and exploring the site, use the comments below or on Youtube or contact me to let me know if you are interested in using the WebQuest, particularly with students away from school due to the coronavirus. This will prompt me to update the links and give the WebQuest a little refresher with more engaging and interactive resources.
The Key Aspects of WebQuests… Described & Illustrated
One way to understand what something is is to look at its “parts.” It helps even more if there’s a discussion of what the “parts” are supposed to do and why. WebQuests are just the same – and it also helps to see examples. That’s what the following video does.
Web site and articles referred to in the video are listed below.
As we all struggle to adapt to life in pandemic times, many schools, teachers and parents are grappling with how to provide online learning for students. Lots of great strategies and platforms exist that didn’t 20 years ago when we were in the heyday of WebQuests, so keep using these things (Google Suite, apps, videos, LMS platforms, etc.). But there will come a time when WebQuests are exactly the solution you’re looking for (he says, confidently). When is this magical time?
You really want to use a WebQuest when…
Obviously, learners have access to the Web 😉
The goal is to develop understanding, not just learn information (e.g., not just memorize or copy/paste). Use the comments link if you want to discuss the difference.
You’d rather guide, than direct, student learning.
The topic is connected to the real world and people often have different opinions or theories about it.
Especially during times of social isolation, you want students to work together and collaborate (even remotely).
How about a refresher on WebQuests?
The video below will take you quickly through the “Parts” of a WebQuest (and why each part is important). Other videos will elaborate on WebQuest design tips.
Resources
WebQuest Template (in HTML format). You can Copy and paste this into a Doc to create a draft of your own WebQuest.
Part of how I get to spend my time these days is to create new learning activities. Recently I’ve been able to dip back into my love of Robert Frost and poetry in general. My long-standing interest in equality for Black Americans was nudged by Black History Month in the US. When I began creating WebQuests, some of my first ones were inspired by this important commemoration. I decided to take a look at what was available on the Web – my starting place is to get excited by the resources I find. What I found were some outstanding short videos on important issues, and, fortunately, interactive maps on each of the topics. This allowed for the creation of the Past IS Present WebQuest.
The Past IS Present WebQuest
After creatively searching the Web, I came up with the following six issues that touched on enough to form a fairly complete experience for students. The issues are:
Redlining (long-term housing discrimination)
Racial Violence (lynching and hate groups)
Confederate Symbols
Gerrymandering (and voter suppression)
Economic Disadvantage
Mass Incarceration
Using my usual WebQuest approach, I begin with one video engage students and help create a little cognitive dissonance. That, “Huh?” experience that slightly disrupts their schema is what’s needed to build to the new “Ah-Ha!” insight and deeper understanding. This is followed by floating some essential questions and encouraging students to Mindmap their current knowledge. To make sure everyone’s got a solid base of shared understanding, years back I added the “Background for Everyone” phase to Bernie Dodge’s original template. This is what I’ve come to call a Knowledge Hunt and isn’t impressive by itself because it can descend into a copy/paste experience for students. Never-the-less, I have made this Background activity freely available, perhaps to entice engaging in the next steps.
Video Introductions and Issue-based Experts
Once all students have a shared background and a Mindmap that illustrates the current schema of their knowledge, the real fun begins. Using Google slides, one short and compelling video for each of the six issues is given to individual (or pairs) of students in a group. After the video, students are given a few additional links and prompted to record new information in a basic 5Ws & H grid. Armed with this, amazingly researchers, non-profits and concerned citizens have posted really engaging interactive maps that allow students to find local instances of the issue. This helps bring home the point – Black history and its injustices in the US are not only distant in time, but often occurring today and often in our own communities. Detailed step-by-step instructions are provided for each map so students can encounter the most compelling data and insights. To give shape to these insights, learners are guided with scaffolds to shape their opinions into a solid thesis statement or argument.
The Group Process and Transformation of Information into Understanding
Those who know me are aware that a small percentage of what are referred to as WebQuests actually fit the bill. Previous research reviewing almost 2,000 self-named WebQuests revealed that only about 16% actually met the main criteria. To put it at its most simple: it’s impossible for students to copy and paste their way to completing a WebQuest. Because the questions are open-ended and the tasks such that they require problem-solving, the focus is one having students transform the acquired information into a new understanding. That’s right, we found that 84% of what are referred to as WebQuests merely ask students to copy and past what they find on Web sites. Obviously, my new Past IS Present WebQuest goes the full distance with scaffolds to help students transform information meaning. It ends with suggestions for ways that students can contribute their learning to the real world such as:
But Wait… You can do rich learning in a shorter timeframe…
Because I know that many teachers don’t have the time to engage students in a real WebQuest, but want to use some of the Web’s rich media for more real and relevant learning, I’ve packaged up just the Introductory Videos on the Six Issues in a Awareness and Mindmapping activity. This way, people can get exposure to the issues and get students thinking. This is a great way to move beyond knowledge acquisition and, perhaps eventually, into a full WebQuest. With all the interest in PBL (Problem-based Learning) again these days, a WebQuest is a handy way to get the most from teacher time and student learning.
A Note on Teachers Pay Teachers. I’ve decided to spend the year uploading activities to TpT after decades of putting work online for free. In some ways I’m both comfortable and uncomfortable with charging for learning activities. Given that I still provide lots for free and have been developing quite detailed and scaffolded activities for TpT, I’m curious to see how things are received.
Every educator is immersed in data every day, but if you aren’t familiar with the main categories of data and how they are analysed, please review the preceding article, Four Types of Data Analytics for Educators. As a reference for what follows, the four types are:
Descriptive – what’s already happened
Diagnostic – why it happened
Predictive – forecasts what might happen in the future
Prescriptive – recommends what to do
It might seem like working with data in any of these four ways is overwhelming, but the truth is, schools are already interacting with data, still few get enough value from it. So much assessing, marking, tracking, conferencing, mentoring, etc. is done at schools, yet, I suggest, the value derived doesn’t match the effort invested. This isn’t anything to be ashamed of, as a profession we are in the early days of using data to achieve our goals for students. So what can schools do?
Four Tips: Educators Leverage Data Analytics
1. Inventory Current Data
It’s like when we’re lost in a new place. We look for a map that tells us, “You Are Here.” Unfortunately the data swirling in schools isn’t laid out as well as a map. So the best thing to do first is to take an inventory of what data sets currently exist. These might be on spreadsheets, in software, on paper, in file folders, etc. Engage staff to brainstorm a comprehensive list. Then filter the list for “what’s valuable.” Not all information contributes to the goals you have for students. This doesn’t mean to discard (unless you can) what doesn’t contribute to your vision for student learning and success, sometimes data are required by sector authorities. But by identifying “your valuable data,” you’re ready for the next step.
Possible Outcomes:
comprehensive list of all data collected / available
identification of the 3-5 most valuable data sets
an idea of where the data resides and in what formats
2. Grow Quality
It might go without saying, but if we want quality insights from our data, we need to start with quality data. My experience suggests that other than school reports and government supplied data, it’s likely that even the most valuable data you’re collecting will “have some issues.” Usually the issues relate to two areas. First, is incompleteness. Perhaps not everyone generates or collects the data or does it inconsistently. The second typical issue is irregularities in timelines: for no obvious reason, sometimes assessments aren’t given some years or to certain cohorts. When you have “holes in your data,” you miss out on the opportunity to see longitudinal trends.
A good way to start is to engage staff in the review and valuation of the data sets and what benefit can be gained. Following a robust discussion about both the effort involved, the benefits gained, and, maybe even, consideration of data types (descriptive, diagnostic, etc.), you will have raised awareness the issues and begun what will be an ongoing dialogue. A main outcome of the process will be deciding which data sets to commit to and enlist full participation from those involved in generating / using the data. Such complete commitment will place a demand on staff who will be contributing so it’s important that everyone see that value, the end goal and how the data will support student success.
The second way to grow quality data is to keep the foundations of measurement in mind: validity and reliability. When an assessment actually provides a good measure of what’s assessed, it’s said to be a valid measure. A classic example, and a pet peeve, of an invalid assessment is using a wordsearch activity to provide insight on students’ knowledge of vocabulary: recognising a row of letters bares no relationship to understanding the word’s meaning. The second criteria is reliability. This is a tricky topic because it usually relates to the differences among humans in their assessment of student performance. The classic example is when the same essay receives difference marks from two readers (or even one reader when hungry or tired). Thus, when a school identifies a valued data source and enlists complete participation, some professional learning and team work will likely be required. On the positive side, this is the kind of learning that develops consistency and dialogue amongst professionals, leading to improved practice and outcomes for students.
The third very positive outcome of growing quality data is to identify what data is missing. This isn’t in relation to inconsistencies and holes as discussed above, but gets to the heart of a collective view of what data is important. Rather than simply “try really hard” to achieve your school or system’s vision for student success, you will have a better time if at least some evidence can validate that you are achieving it. Thus, what else would you really like to know about students’ performance? A common response is to recognise missing data related to such things as student wellbeing, critical thinking, non-cognitive skills, creativity, etc. Identifying and then developing or sourcing such additional measures is part of growing quality data. It also helps engage staff who will see that data goes beyond a numeric or letter snapshot of students, that by layering dimensions, we can build a more complete picture of what student success looks like and how to achieve it.
Possible Outcomes:
community buy-in on which are the “valued” learning data
a more disciplined schedule of diagnostic assessments
professional learning and consensus on moderation of student work and its merits
identification and sourcing of currently un-assessed traits or skills
staff ownership of and commitment to growing quality data
Given a whole school / system approach and time, you will have solid descriptive and diagnostic data to build predictions. Which leads to…
3. Engage Hypotheses
Even before your school has friendly analytical data software in the hands of every teacher, to grow a culture of data-informed professionals, consider action research, faculty-based pilots or simple whole school initiatives to practice a “closed loop” curriculum. An example of this “closed-loop” is when unexpected variations in descriptive data or learning gaps in diagnostic assessments confirm or challenge staff members’ perceptions. Having a data point to work with, staff then explore the units and lessons related to those variations or gaps followed by a professional sharing of effective targeted solutions. Sometimes solutions will need to be created, but often some staff members have a great lesson or activity that suits the need. These solutions are then built into the curriculum and used in all appropriate classrooms / school spaces. Team teaching, peer feedback or other mentoring approaches might be needed to help all staff master the solution. After the usual instructional cycle (lesson? unit? semester?), a valid and reliable assessment is made to determine if the hypothesised solution was effective. This is simply the scientific method (or common sense?) that, once established in the culture, guarantees continuous improvement.
Possible Outcomes:
initiate simple approaches across the whole school (e.g., uniform beginning / ending routines for all lessons, use of open-ended questions, common writing rubrics across subjects, etc.)
pilot closed-loop solutions in a cohort or course
expand effective approaches used by only some teachers to all in a faculty
trial new approaches that have proved effective at other schools
test new measures for things like wellbeing, creativity, etc. to see if they generate the desired data insights
All these efforts will need to have defined data collected, then reviewed, to determine each initiative’s effectiveness.
Beginning this closed loop curriculum cycle, even before all quality data is grown, engages staff in the practice that will ultimately make the data useful. Even the best quality data sets are worthless if the insights they provide are not brought to life and inform teaching and learning practices.
4. Dissolve Silos
Going back to the first tip, review all the different places your school’s data resides and their formats: student administration systems, state and national log-ins, online software, paper results, spreadsheets, etc. It’s not realistic to think that all your data will exist in one system, but software is always under development, and being able to import, share or read data across platforms has become a requirement. However, as in any area, there are leaders and laggards in the field of educational technology. Rather than think you need to begin this work with a comprehensive new data analytics system, because software improves quicker than school cultures change, start with the systems you’re already using and identify aspects that contribute to gaining immediate insights into students’ learning. Get the most from what is immediately available. Then, as your staff gets accustomed to using valuable data insights, focus on the learning insights you want to gain. Avoid getting bogged down in evaluating the feature lists of various software platforms. Approach the vendors with your goals and make them show you whether their software can easily produce quickly visualised displays – or at least how close they can get. No software is perfect or ever truly finished, so look for vendors who want input and have reliable roadmaps. Also, remember, it’s the data analytical insights you want, not bells and whistles.
Possible Outcomes:
The reason we want to dissolve the silos of separate data sets is because we hope insights can be gained by combining information that now sits in isolation. For example, can we gain insights by:
comparing class grades to student performance in related diagnostic assessments
aligning wellbeing measures to semester grades or class rank
looking at whether a correlation exists between co-curricular participation and academic achievement
assessing intrinsic motivation or study skills in comparison to other elements of a vision for student success
Conclusion
Being able to crunch and dig deeper in the collective data you value will not happen overnight. On the positive side, as time passes, smarter software is always developed, so by the time you have grown several years of quality data and engaged staff in educational hypotheses, you will have a very good idea of the kind of functionality and easy visualisations you need to achieve the goals you have. After decades of using educational technology, we know there is no end point, no “there” that we will get to, but recognise that this is a space of constant evolution where we sometimes merge pieces together and at others we’re better off starting with a clean slate. So don’t rush to get “the latest” technologies, but nurture a school culture around data-informed improvement and build relationships with vendors to see who’s selling software and who’s targeting solutions. Remember, unless we start now and make this a new routine, another generation of teachers and students can pass through your school missing out on the assistance quality data can provide.
A quick survey of the Web turns up many helpful pages on data analytics. But because data is the currency of our now digital economy, the articles typically focus on the business world. Any mentions of data in terms of education usually surface one of three understandable perspectives: protecting student privacy, boosting engagement (i.e., $) and the mostly misguided use of high-stakes, though meagre, metrics to represent human learning.
Furthermore, some educators can be hesitant about “data.” Maybe data seems like numbers and graphs while our role is to nurture growth in human beings? But the right data is an asset in our very human task as it can provide some evidence about how things are going. Quality data, easily accessible and effectively visualised is one way to gain insights on such questions as:
Are students learning?
What are they learning?
What aren’t they learning that could help them grow?
What pedagogical approaches are the most effective for which students?
How can our school and system use these insights to keep getting better?
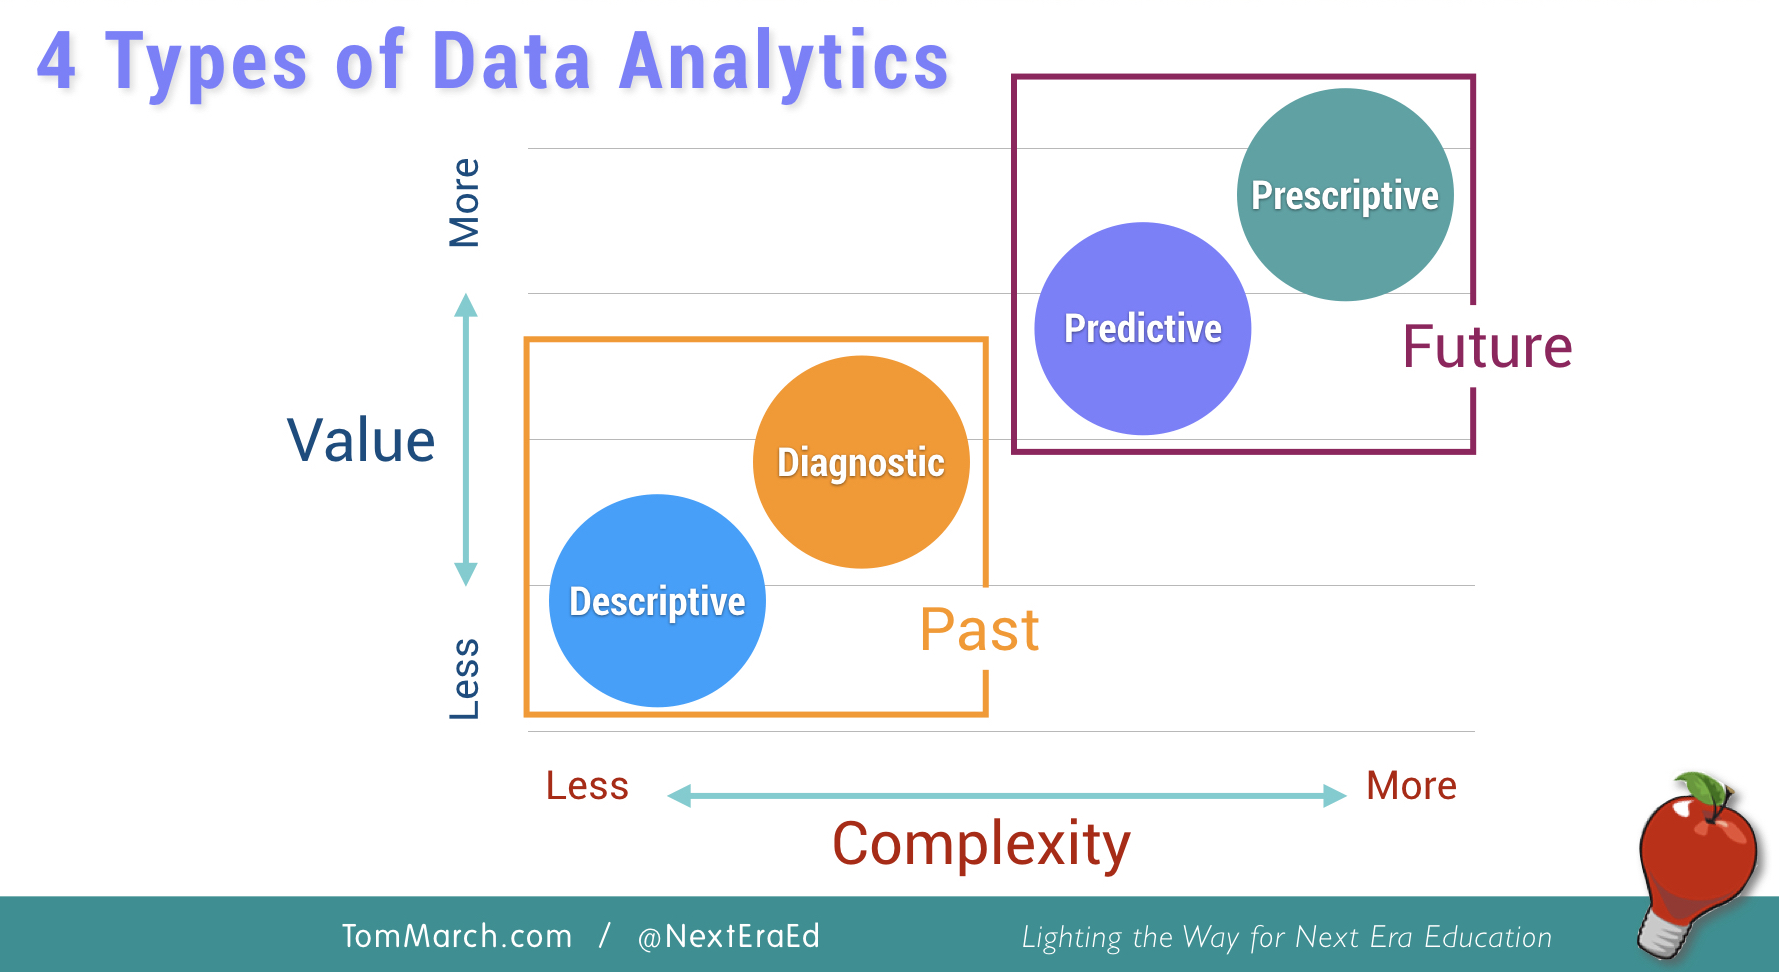
This post will provide background on the four types of data analytics and offer four tips for educators. Let’s start with a graphic that we can unpack:
What are the Four Types of Data Analytics?
A handy way to understand data analytics is to view it in terms of what it can do for us:
Describe – what’s already happened
Diagnose – why did it happen
Predict – forecasts what might happen in the future
Prescribe – recommends what to do
The first handy thing to notice is that the “D”s are about the past and the “P”s are in the future. The other useful dimension is the common sense relationship between value and complexity: the simplest data is also the least useful, whereas the most complex has the potential to add the most value.
Now let’s see how the the four types of analytics align with data sources schools already know. I’ll also highlight how complexity and value factor in.
Descriptive Analytics
Descriptive analytics can tell us “what happened.” This is by far the most common type of data used in schools. When teachers give tests at the end of a unit and assign a mark or compile semester reports, they are generating descriptive data. Other kinds of descriptive data schools might collect are attendance records, participation in co-curricular activities, literacy progressions, feedback surveys, etc.
Value and Complexity
Teachers and schools invest extraordinary resources collecting such information, so it’s unfortunate that these only provide a simple “backward glance”. As much detail as a teacher might consider before assigning a result, in the end, it’s typically an A-E grade or 0-100 percentage.
Applying Analytics
Probably the main applications of these datasets are ranking students and potentially serving as extrinsic motivation. However, careful analysis of such descriptive data across a school can help identify variability (and success?) among teachers and faculties, identify patterns for specific student cohorts, and compare academic achievement in the context of things like school engagement and well-being.
Diagnostic Analytics
Diagnostic analytics offer more in-depth insights into student performance or ability. In Australia, when people think of diagnostic data in education, what comes to mind are standardised or “high stakes” tests such as the National Assessment Program – Literacy and Numeracy (NAPLAN) or ACER’s Progressive Achievement Tests (PAT). In the primary years, many schools use commercial benchmarking programs (such as PM, F & P and Probe). Some online programs / apps also provide diagnostic data. In the classroom, many teachers use formative assessments and rubrics to assess students’ skills. What these all have in common is that, just like a medical doctor reviewing blood tests or x-rays, diagnostic assessments provide greater detail about what’s going on.
Value and Complexity
This greater detail we can call “granularity”. So the real benefit of, say, a NAPLAN Reading assessment is not to find out what Band a student is in, but to gain insight into a student’s strengths and gaps in core skills related to the domain such as “connecting information,” “applying comprehension” or “inferencing.” With this greater degree of complexity, you can see how the value increases. Rather than try to help that student “read better,” we can target teaching to fill gaps and extend strengths.
Applying Analytics
Taking advantage of the diagnostic assessments used in a school is a challenge, mostly because the data is buried and not easily visualised. When teachers, faculties, grade-levels teams and leaders can quickly see such gaps and strengths across core skills at the student, class and cohort levels, each stakeholder is empowered to support targeted solutions.
Predictive Analytics
Predictive analytics can offer insights into “what is likely to happen.” It uses the results of descriptive and diagnostic analytics to predict future trends. As such, predictive analytics forecast likely outcomes to be pursued or avoided. Many schools employ data consultants to conduct statistical reviews of past performance in high-stakes measures, especially Year 12 results such as HSC, VCE and Advanced Placement tests.
Value and Complexity
Clearly, because solid predictive analytics is based on equally solid descriptive and diagnostic data, it is more complex to gather and analyse. The reason schools often outsource this analysis to data experts is because of the statistical analysis required and also the savvy to integrate appropriate data sets. Equally complex is the interpretation of the analysis so that patterns aren’t seen as causative when they might really only correlate (e.g., high participation in co-curricular activities may correlate with high achieving students, not cause the high achievement).
Applying Analytics
Besides employing data scientists, schools can begin use of predictive analytics by identifying what information they most value about students and their learning. This might require introducing new descriptive and diagnostic measures and then taking several years to grow these data sets.
Prescriptive Analytics
The fourth type of analytics results in actual prescriptions of “what action(s) to take” to solve a problem in the future or to take full advantage of promising trends seen in the predictive analysis. Many schools engage in pedagogical initiatives such as Reading Recovery, Maker Spaces, STEM, writing across the curriculum or wellbeing programs, but such decisions typically lack a robust foundation in hard data. It’s not that such initiatives are bad, but when they are begun without targeting an evidence-based issue with aligned pedagogical solutions, measuring success is ad hoc at best. One downside of such initiatives lacking credible success criteria is the drain on staff morale and change fatigue. We are all motivated when we perceive ourselves as being effective. Without measures, this is difficult.
Value and Complexity
Like predictive analytics, prescriptive is also based on data from each of the other types and thus requires both quality data and insights (see the next article on Tips for Educators). Obviously, the value-add of such predictive analytics is great, but the complexity needed to combine and model the data is comparably great.
Applying Analytics
Both the value and complexity of prescriptive analytics suggests not only the participation of experts, but also technology. In fact, this is where many tech companies get involved and apply Artificial Intelligence to the rapid modelling of data. “Big data” sets are needed for algorithms to apply both unstructured and structured analysis to tease out reliably demonstrated outcomes. A good example is the increasing sophistication and accuracy of tech giants like Google and Amazon to make suggestions based upon constructed profiles for each user. In this way AI can move beyond more simple “if/then” predictions to an assurance that specific actions will lead to the desired outcome. Extensive work is being done in this area at the university level.
Where to Next?
As you can see, most schools would collect, use and benefit from each of the four types of data analytics. Yet, it’s the rare school that has a mature approach to managing and employing the data circulating through its software, systems and folders. Now that you have more background on the types of data and analytics, please read the next article offering 4 Tips on Data Analytics for Educators.
In practice, they are basically like targeted, reusable worksheets, but with some advantages.
Here’s a sample of a set I’ve made for close reading and enjoyment of Robert Frost’s poetry. This is one of 72 cards in a set exploring three poems (24 cards / poem).
You can see what the main parts of the card are (click the image to see a larger version):
Why are the a Friend to Students?
The main advantage of task cards is they act as one-on-one coaching to students. Instead of sitting passively in group discussions, students have a targeted task that supports the learning goal. The fact that cards come in a set makes them even more useful to students – they can choose the task and pace that best matches their current interests and abilities.
Why are the a Friend to Teachers?
First, every teacher (human!) likes to be effective. Knowing that students are getting one-on-one tasks increases your effectiveness. Doesn’t that down time – when some students have completed a task and sit idly waiting for the next – tug at your heart? Quality Task Cards target a continuum of content, skills or understandings so when one task is completed, there’s the next, ready for learning!
Second, having just mentioned “content, skills or understandings” and “quality,” the best cards go beyond pointing students to retrieve or demonstrate declarative knowledge. Sure this is part of learning, but it’s the foundation, not the pinnacle. So notice the “Task 1” and the numbers in the lower right corner (1-4). These illustrate that Task Cards easily support a range of cognitive and even affective learning. See how the four cards below progress in level of challenge and openness?
Card 1 simply asks students to read the poem. Card 2 prompts an engagement with the content. Card 3 asks students to draw inferences / make an interpretation. Finally, Card 4 moves beyond the surface of the poem into reflection and connection to students’ body of expertise.
Third, the savvy teacher can use such cards in many ways. Here are a few examples:
Differentiation: Some students use only cards 1-2 to focus on developing a solid foundation before advancing to cards 3-4. Extension activities in Cards 3-4 can be the main activity for more advanced students.
Jigsaw Groups – have students work in groups of 4 (or 8 if they need the additional support of a partner). Students in the group are then responsible for each task before sharing their learning to the group
Teachable Moments – If students become stuck on any one card, that’s great formative feedback and tells you that you have an opportunity to do some targeted teaching. You can have students offer their answers to inspire a class discussion or socratic session. Notice that because the cards are not seeking “right answers,” getting students to share their ideas to the whole class multiplies insights and learning.
Sponge, Lesson or Unit – Because the cards come in sets, teachers can choose whether to use a card as a sponge or bell-ringer activity to engage students in learning rather than lose precious time. A whole level or set could serve as a lesson. Or, when the sets target broader and deeper content, use them as a core part of a unit. For example the set I’ve made on Robert Frost promotes a close reading and analysis of three of his most important poems. That’s a main part of a poetry unit ready and waiting.
Personalized Learning – each student can move through a set of cards are her or his pace. This is especially true when Answer Cards are provided as in the Frost set. Click the image below to see a larger version.
Fourth, did you notice that all this learning required NO ADDITIONAL preparation or grading! What better friend for teachers to have than ready-made and effective learning activities?! Remember that you can then re-use them whenever you like and in any of the above and other ways. The friendship keeps on growing!
Please let me know what you think and suggest other poets for whom you’d like to see such Task Cards made. You can use the comments, email or contact form.
You might be familiar with this quotation from the master. What’s usually shared is only the first part:
We all know that art is not truth. Art is a lie that makes us realize truth,
Certainly this is the magic of any real work of art, regardless whether it’s painting, sculpture, poetry, prose, music, filmmaking, etc. The artist brings together insight and techniques to communicate something that is usually impossible to communicate in direct statement. Typically, this is because the “truth” of anything of significance is more complex and multi-layered, and these insights on a broader and deeper story are what we can see and feel in the presence of great art.
Or can we?
This is where the ending of the sentence comes in, the one that’s often left off.
at least the truth that is given us to understand.
The “us” in this statement is, of course, the artist, who must have some understanding worth sharing. But this “us” is also “us,” the viewers, the audience, those of us attempting to perceive the artist’s truth. Lived experience is sometimes the only preparation needed, but we can all look to learning experiences we’ve had that developed a more ready foundation to realize the understandings communicated in great art.
And when we have this greater foundation and we can see and feel more, we are more fully human. This is the benefit of a real education and the crime of inflicted education, schooling that isn’t wholly focused on allowing each individual to develop their own richer understandings.
Let’s keep the pursuit of this truth deep in our hearts and the front of our minds as we use what we know works in classrooms: giving students meaningful choices in the development of their education as we support their increasingly sophisticated competence in a culture of mutual respect and growth.
Thanks, Picasso and all the masters who have enhanced our lives.
Political corollary: Interesting that some leaders in my home country today are having difficulty understanding that great work of political art: The US Constitution, and the framers’ emphasis that no one is above the law. Perhaps some missed the lesson plan distinguishing between art and propaganda? Real, rich and relevant education matters.
Credits
Quote from a 1923 interview with Pablo Picasso in the New York City periodical “The Arts: An Illustrated Monthly Magazine Covering All Phases of Ancient and Modern Art” as evidenced by The Quote Investigator. Picasso Image from Wikimedia Commons
You have to love it when a master of the artform begins one of her poems with this line. Marianne Moore‘s most famous poem, simply entitled Poetry, is a lesson in why poetry matters.
She’s obviously taking issue with the “art” of poetry, the fiddly terms, techniques and devices that poets use – and abandons most of them!:
Forget all that rhyme scheme, ABAB, business
Skip the scansion looking for iambs, trochees and meter
and you won’t even find much in the way of euphony, alliteration, etc.
But you will find a conversational voice, logic and amazing imagery. All to the point of challenging: if you are interested in “the raw material of poetry in / all its rawness” and “the genuine, then you are interested in poetry.”
And bitten by this interest in (life? reality? shared experience?), the irony is that we need to master What poetic devices are and How they are used so we can gain insight into the genuine: Why poets choose their “fiddly techniques” to communicate their vision of the genuine. To our edification, annoyance, sympathy, insight, etc.
You might wonder why I’m fixating on poetry these days. It’s because I’m digging back into my passion for it to create a set of learning activities that can help students (everyone?) to “Get Poetry” as something vibrant, not schoolish or a problem to solve. My goal in the “Getting Poetry” series is:
to help students understand and appreciate poetry so much they might cry, sigh, smile or memorize!
I think our world could do with a little more poetry. We live in polarized times where monumental decisions get made off the back of three word simplifications like “Get Brexit Done,” “Build a Wall” and “Stop the Boats.”
At the risk of offending sensibilities, can I suggest that life is more complex than these phrases imply? Pick whatever outcome you believe in, but a moment to pause, reflect and experience could go a long way to furthering communication and maybe even bridging some divides.
Great poetry is one way to prompt such a “pause, reflect and experience.” Poetry, like life, is not a riddle to be solved. Also like life, assuming that we “get” all poems or poets, like “getting” everything in life, can lead people astray.
Better to seek what’s real for you, make connections and find insights. Today let’s entertain a poet radical enough to question the importance of poetry itself – especially when compared to the power of love.